what & why
Let’s say you have a scalable architecture (like a server/worker model), and you want autoscaling to happens automatically based on the workers CPU usage, which is useful is some scenarios. Kubernetes has an Horizontal Pod Autoscaler feature that we can utilize to do just that !
how
First, let’s talk requirements. You’ll need :
- a
k8s cluster(k0s, minikube or microk8s), kubectlinstalled and configured to talk to your clustermetrics-serverdeployed. This will provide the metrics necessary for the autoscaling algorithm to work. Check on your particular provider how to do so.
example architecture
Here is an example architecture that can benefit from scaling :
- a server that sends out jobs
- X workers that do_work() when receiving a job
- a way for the server to communicate with the workers, a message queue for example.
In our demo, we have the following resources running on a k8s cluster :
-
a
rabbitmqdeployment, with arabbitmqservice. -
a
serverdeployment, based onk0rventen/hpa-server, with the following logic:import time, json from random import choices, randint from string import ascii_letters import pika QUEUE_NAME = "foo" connection = pika.BlockingConnection(pika.ConnectionParameters('rabbitmq')) channel = connection.channel() channel.queue_declare(queue=QUEUE_NAME) if __name__ == "__main__": while True: obj = {"payload":"".join(choices(ascii_letters,k=10))} channel.basic_publish(exchange="", routing_key=QUEUE_NAME,body=json.dumps(obj)) time.sleep(randint(1,11)/10)It basically connects to the rabbitmq broker, declare a new
fooqueue, and then sends message to that queue forever, every .1 to 1s (which averages to around .5s). -
a
workerdeployment, runningk0rventen/hpa-worker, with this code :import time, pika QUEUE_NAME = "foo" connection = pika.BlockingConnection(pika.ConnectionParameters('rabbitmq')) channel = connection.channel() def callback(ch, method, properties, body): t0 = time.time() while time.time() < t0+.8: # work for .8s, which is a bit more than the interval between jobs sent by the server 1*1 ch.basic_ack(delivery_tag = method.delivery_tag) if __name__ == "__main__": channel.basic_consume(queue=QUEUE_NAME,on_message_callback=callback) channel.start_consuming()the worker connects to the queue declared by the server, and for each message, it works for .8s.
The worker takes around .8s to process the job. Based on how many jobs per second are sent by the server, we might run into a situation where the worker is overloaded, and can’t keep up. Jobs will just pile up, and that’s not good. But it’s also pointless to just scale the workers manually, eg k scale deploy worker --replicas 6, and have too many instances just waiting when no jobs are sent, but 6 might be not enough if we encounter a spike in usage.
To follow along, create the following resources :
# namespace
k create ns hpa

# rabbitmq message bus
k create -n hpa deploy rabbitmq --image rabbitmq:3-management --port 5672 --port 15672
k expose -n hpa deploy/rabbitmq --port 5672 --target-port 5672

# server
k create -n hpa deploy server --image=k0rventen/hpa-server

# worker
k create -n hpa deploy worker --image=k0rventen/hpa-worker
we can now connect to the rabbitmq ui using k port-forward -n hpa deploy/rabbitmq 15672:15672 and opening localhost:15672.
HPA based on CPU usage
For the autoscaling to work, we need to specify what cpu usage percent is considered a threshold to spawn new instances. With metric-server, we have the raw cpu usage for each pod (let say our worker consume 900m cpu). But that doesn’t translate into percentage until we specify limits for our containers. For that, we’ll edit the worker deployment, and add resource limits to the container spec:
k edit deploy/worker -n hpa
    ...
    spec:
      containers:
      - image: k0rventen/hpa-worker
        imagePullPolicy: Always
        name: hpa-worker
        resources:
          limits:
            memory: "128Mi"
            cpu: "100m"
      ...
We are enforcing a limit of 100m cpu. The single worker will now be pinned at 100m CPU usage, which you can check via kz top pods -n hpa | grep worker.
We can now configure our HPA to scale the number of replicas of our worker deployment with the following settings :
k autoscale -n hpa deploy worker --max 8 --min 1 --cpu-percent 50
--minis the minimum number of replicas to have.--maxis the maximum number of replicas to have. Note that this number may not be achieved due to resources constraints. A simple example is with a host having 2 CPUs (or 2000m CPU), and a worker consuming 200m CPU, you won’t be able to have more than 10 replicas.--cpu-percentis the percentage of CPU usage above which the autoscaler will add new instances (and vice-versa).
We can check what the hpa is doing with kz describe hpa -n hpa worker :
Events:
  Type    Reason             Age    From                       Message
  ----    ------             ----   ----                       -------
  Normal  SuccessfulRescale  4m18s  horizontal-pod-autoscaler  New size: 3; reason: cpu resource utilization (percentage of request) above target
  Normal  SuccessfulRescale  2m33s  horizontal-pod-autoscaler  New size: 4; reason: cpu resource utilization (percentage of request) above target
  Normal  SuccessfulRescale  33s    horizontal-pod-autoscaler  New size: 5; reason: cpu resource utilization (percentage of request) above target
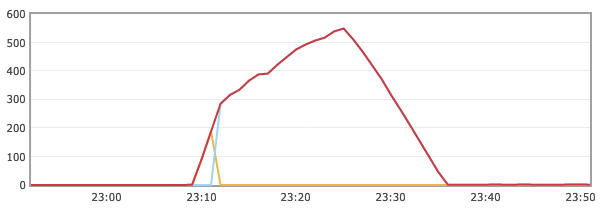
On the rabbitmq dashboard, we can see the number of messages queued going downhill since the activation of the HPA :
And once the queued messages are all processed, the workers’s CPU usage will drop, and the HPA will decrease the number of replicas to match that level of load. In our case it might drop to 2 or 3 replicas :
Events:
  Type    Reason             Age    From                       Message
  ----    ------             ----   ----                       -------
  Normal  SuccessfulRescale  24m    horizontal-pod-autoscaler  New size: 3; reason: cpu resource utilization (percentage of request) above target
  Normal  SuccessfulRescale  22m    horizontal-pod-autoscaler  New size: 4; reason: cpu resource utilization (percentage of request) above target
  Normal  SuccessfulRescale  20m    horizontal-pod-autoscaler  New size: 5; reason: cpu resource utilization (percentage of request) above target
  Normal  SuccessfulRescale  8m30s  horizontal-pod-autoscaler  New size: 4; reason: All metrics below target
  Normal  SuccessfulRescale  3m27s  horizontal-pod-autoscaler  New size: 3; reason: All metrics below target